Large-scale Image Retrieval using Scene Maps
State of the art data mining and image retrieval in community photo collections typically focus on popular subsets, e.g. images containing landmarks or associated to Wikipedia articles. We propose an image clustering scheme that, seen as vector quantization, compresses a large corpus of images by grouping visually consistent ones while providing a guaranteed distortion bound. This allows us, for instance, to represent the visual content of all thousands of images depicting the Parthenon in just a few dozens of scene maps and still be able to retrieve any single, isolated, non-landmark image like a house or a graffiti on a wall.
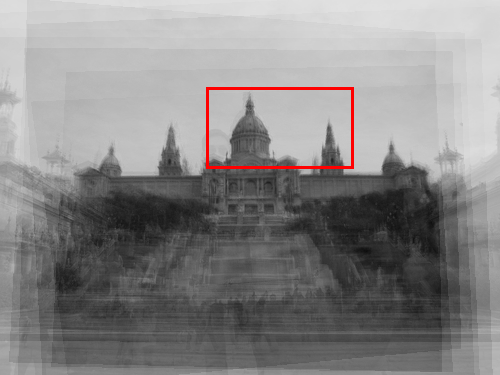
Figure 1. Scene map construction from 10 photos of Palau Nacional, Montjuic, Barcelona.
View Clustering
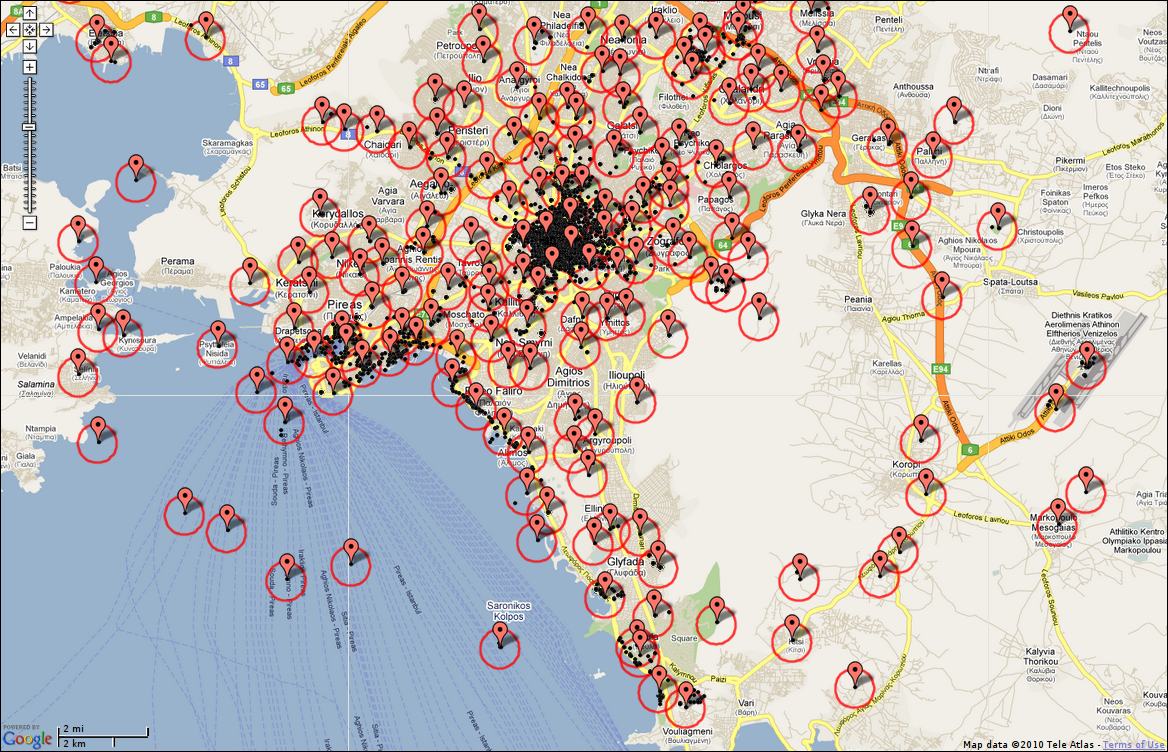
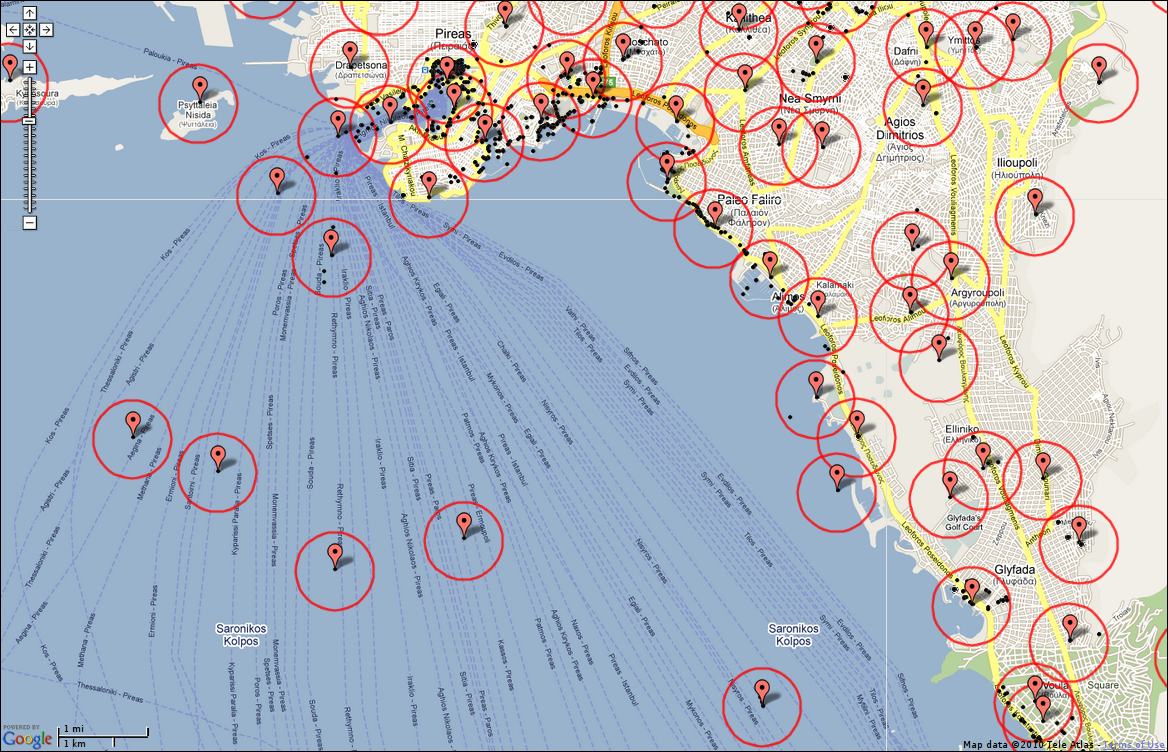
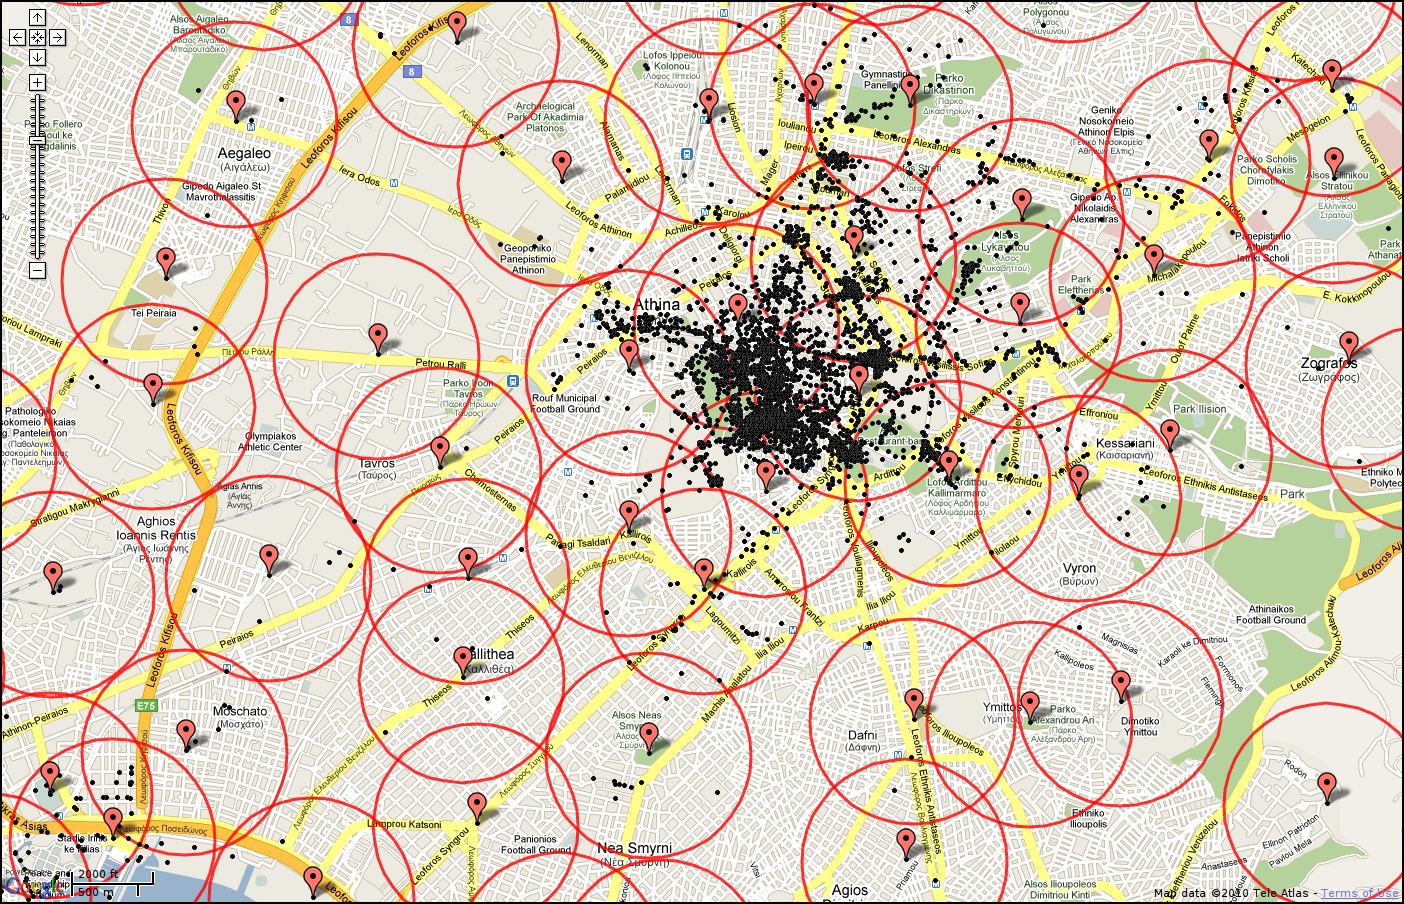
Starting from a geo-tagged dataset, we first group images geographically and then visually. To identify images that potentially depict views of the same scene and then compute visual similarities, we rely on maximal geographical distance. E.g., two images taken 2km apart are unlikely to depict the same building. Figure 2 shows the geo-clusters extracted over Athens at different zoom levels.
 |
 |
 |
 |
Figure 2. Maps of Athens illustrating geo-clusters at four different zoom levels. Black dots, red markers and red circles stand for photos, codebook vectors and cluster boundaries, respectively.
Likewise, in order to identify similar views of a single scene we use RANSAC spatial matching, which relies on the number of inlier visual features found between two images. In this case e.g. 20 images, each having at least 15 inliers with a reference image, may all depict similar views of a single scene. Figure 3 shows photos associated to the centres of the largest visual clusters of Pantheon and Figure 4 photos contained in a sample of visual clusters from the same landmark.
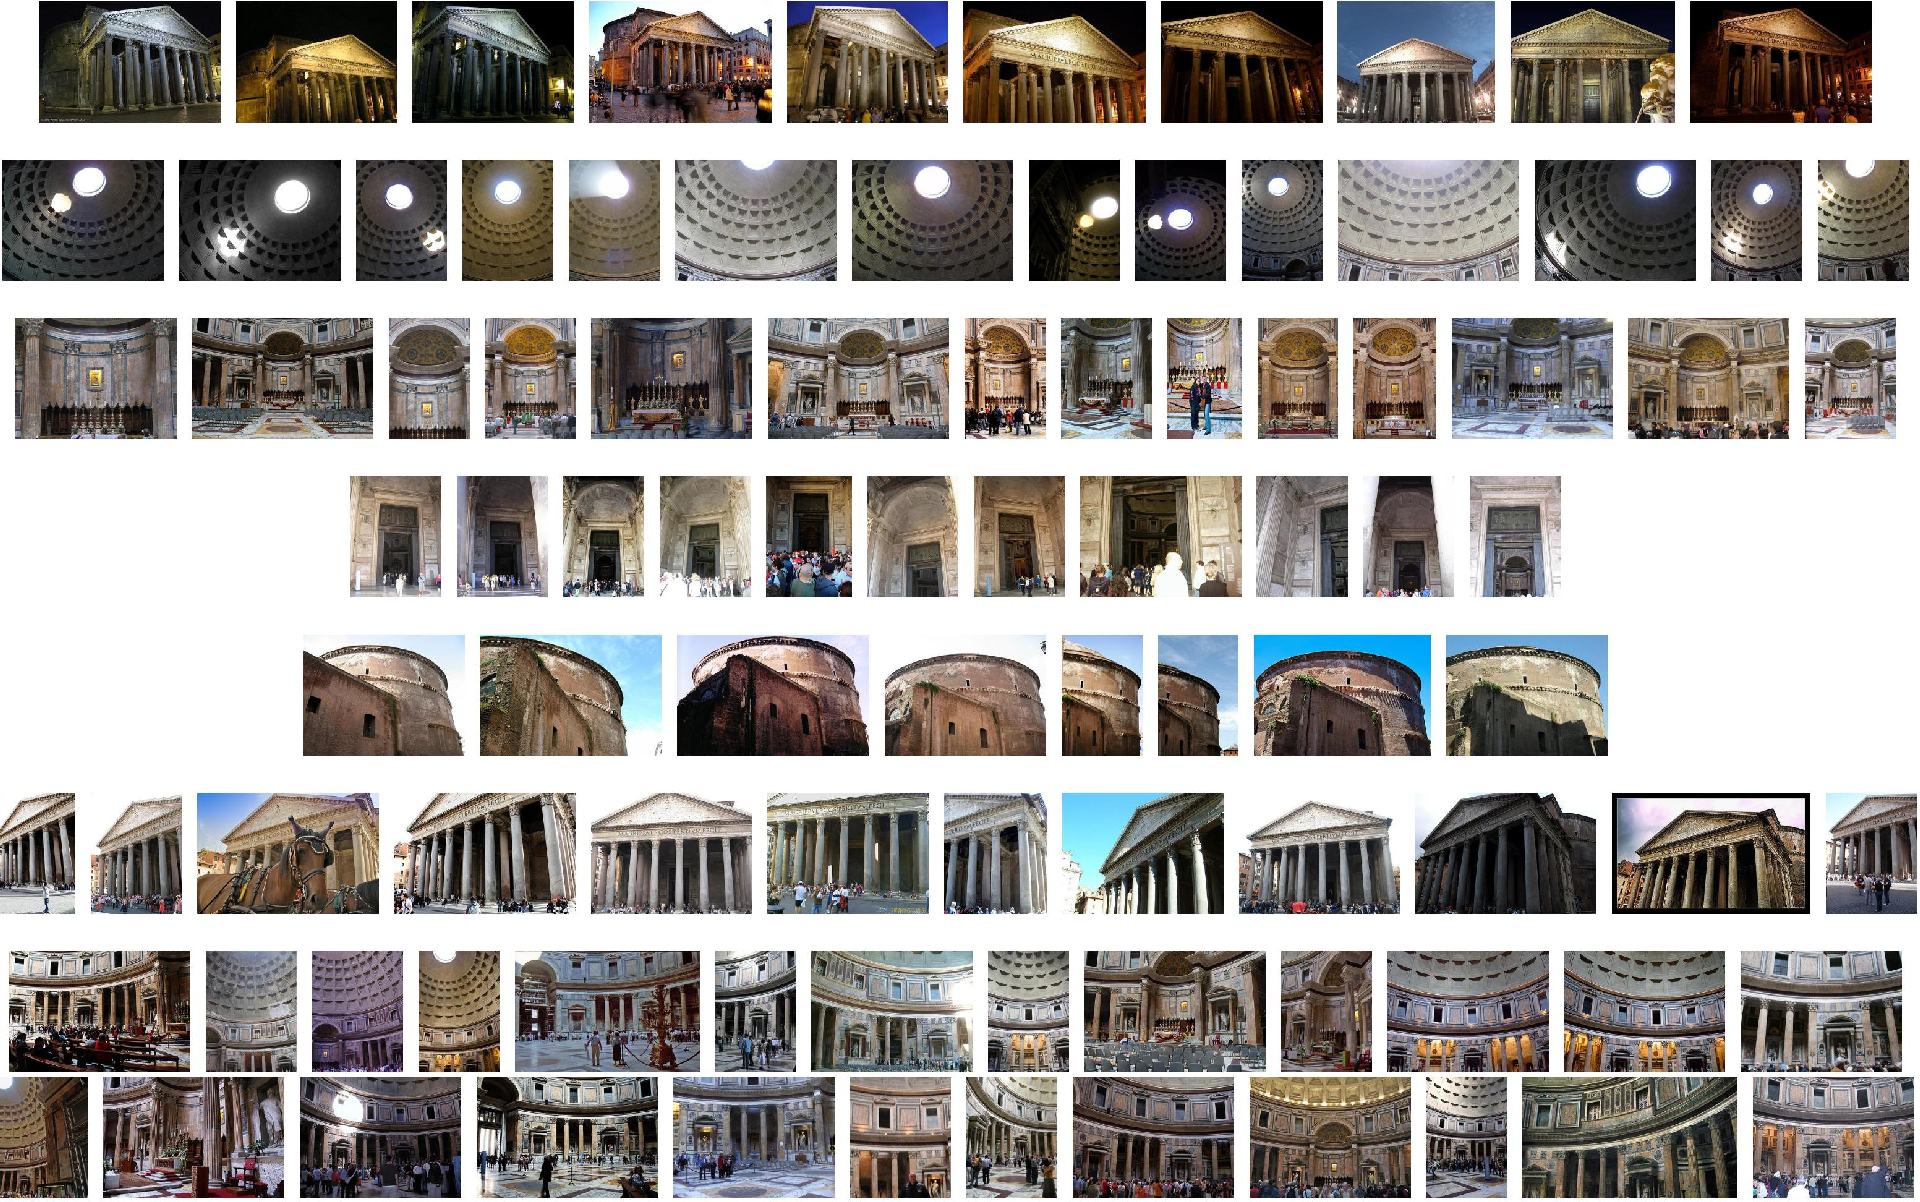 Figure 3. Photos associated to the centers of the most populated visual clusters from Pantheon, Rome. |
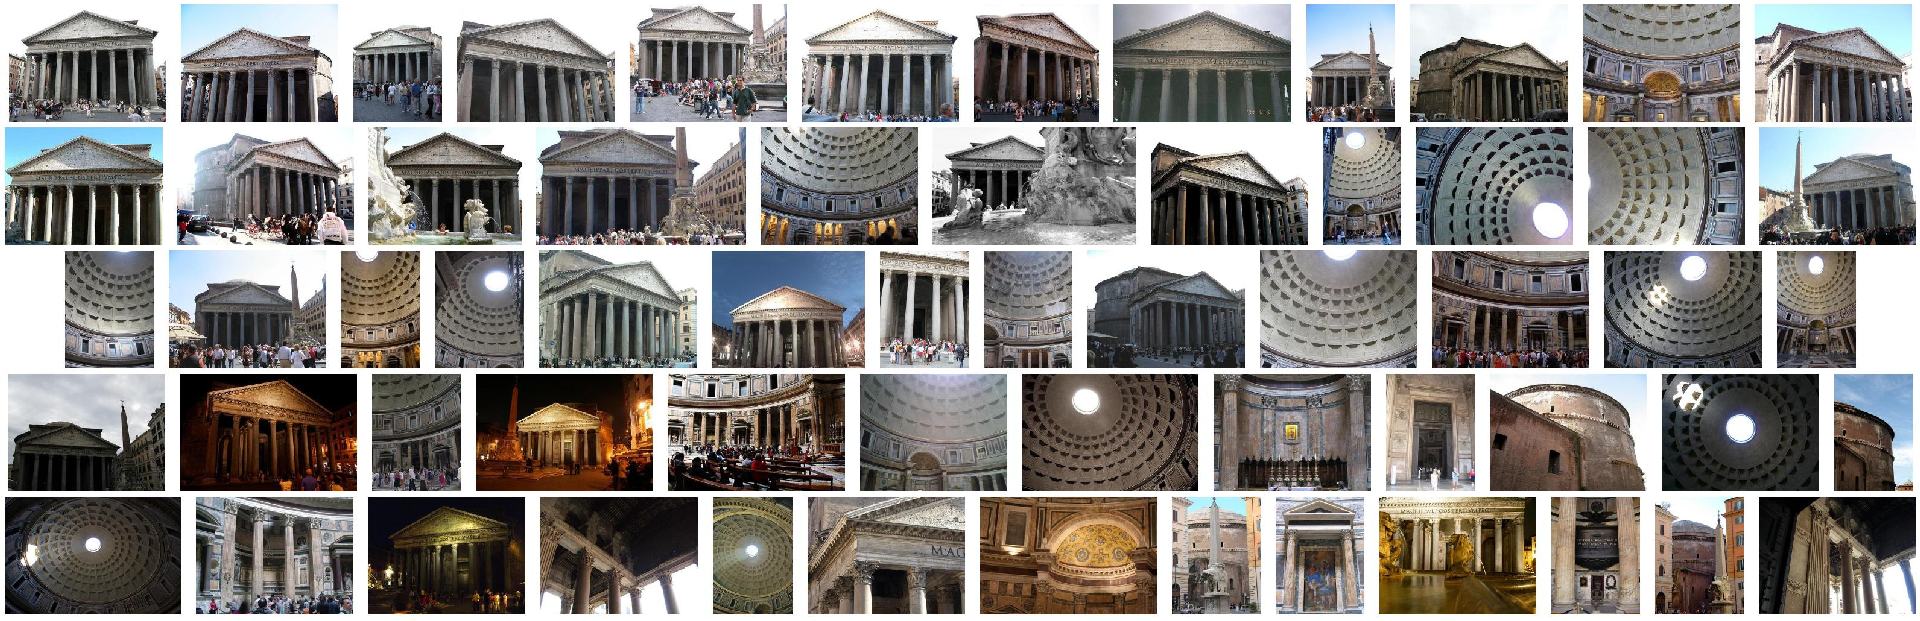 |
Figure 4. Photos in a sample of visual clusters from Pantheon. The first image (on the left) of each cluster corresponds to the cluster center.
To perform clustering, both at the geo-tag and the visual level, we use kernel vector quantization (KVQ), along with an appropriate metric for each of the two cases. Contrary to e.g. k-means or agglomerative clustering, it guarantees that no image in a geographic cluster is taken too far away from a specific location, and no image in a visual cluster has too few inliers with a specific image.
To speed up the mining process, we apply visual clustering only to the set of images in a single geographical cluster and we use sub-linear indexing to compute the required pairwise dissimilarities. Given a visual cluster, we align all images to a reference image by homography estimation and construct a 2D scene map by grouping similar local features, which gives rise to another application of KVQ: no feature in a cluster should be too far from a specific feature, where by "far" we mean either spatially or in terms of appearance.
 |
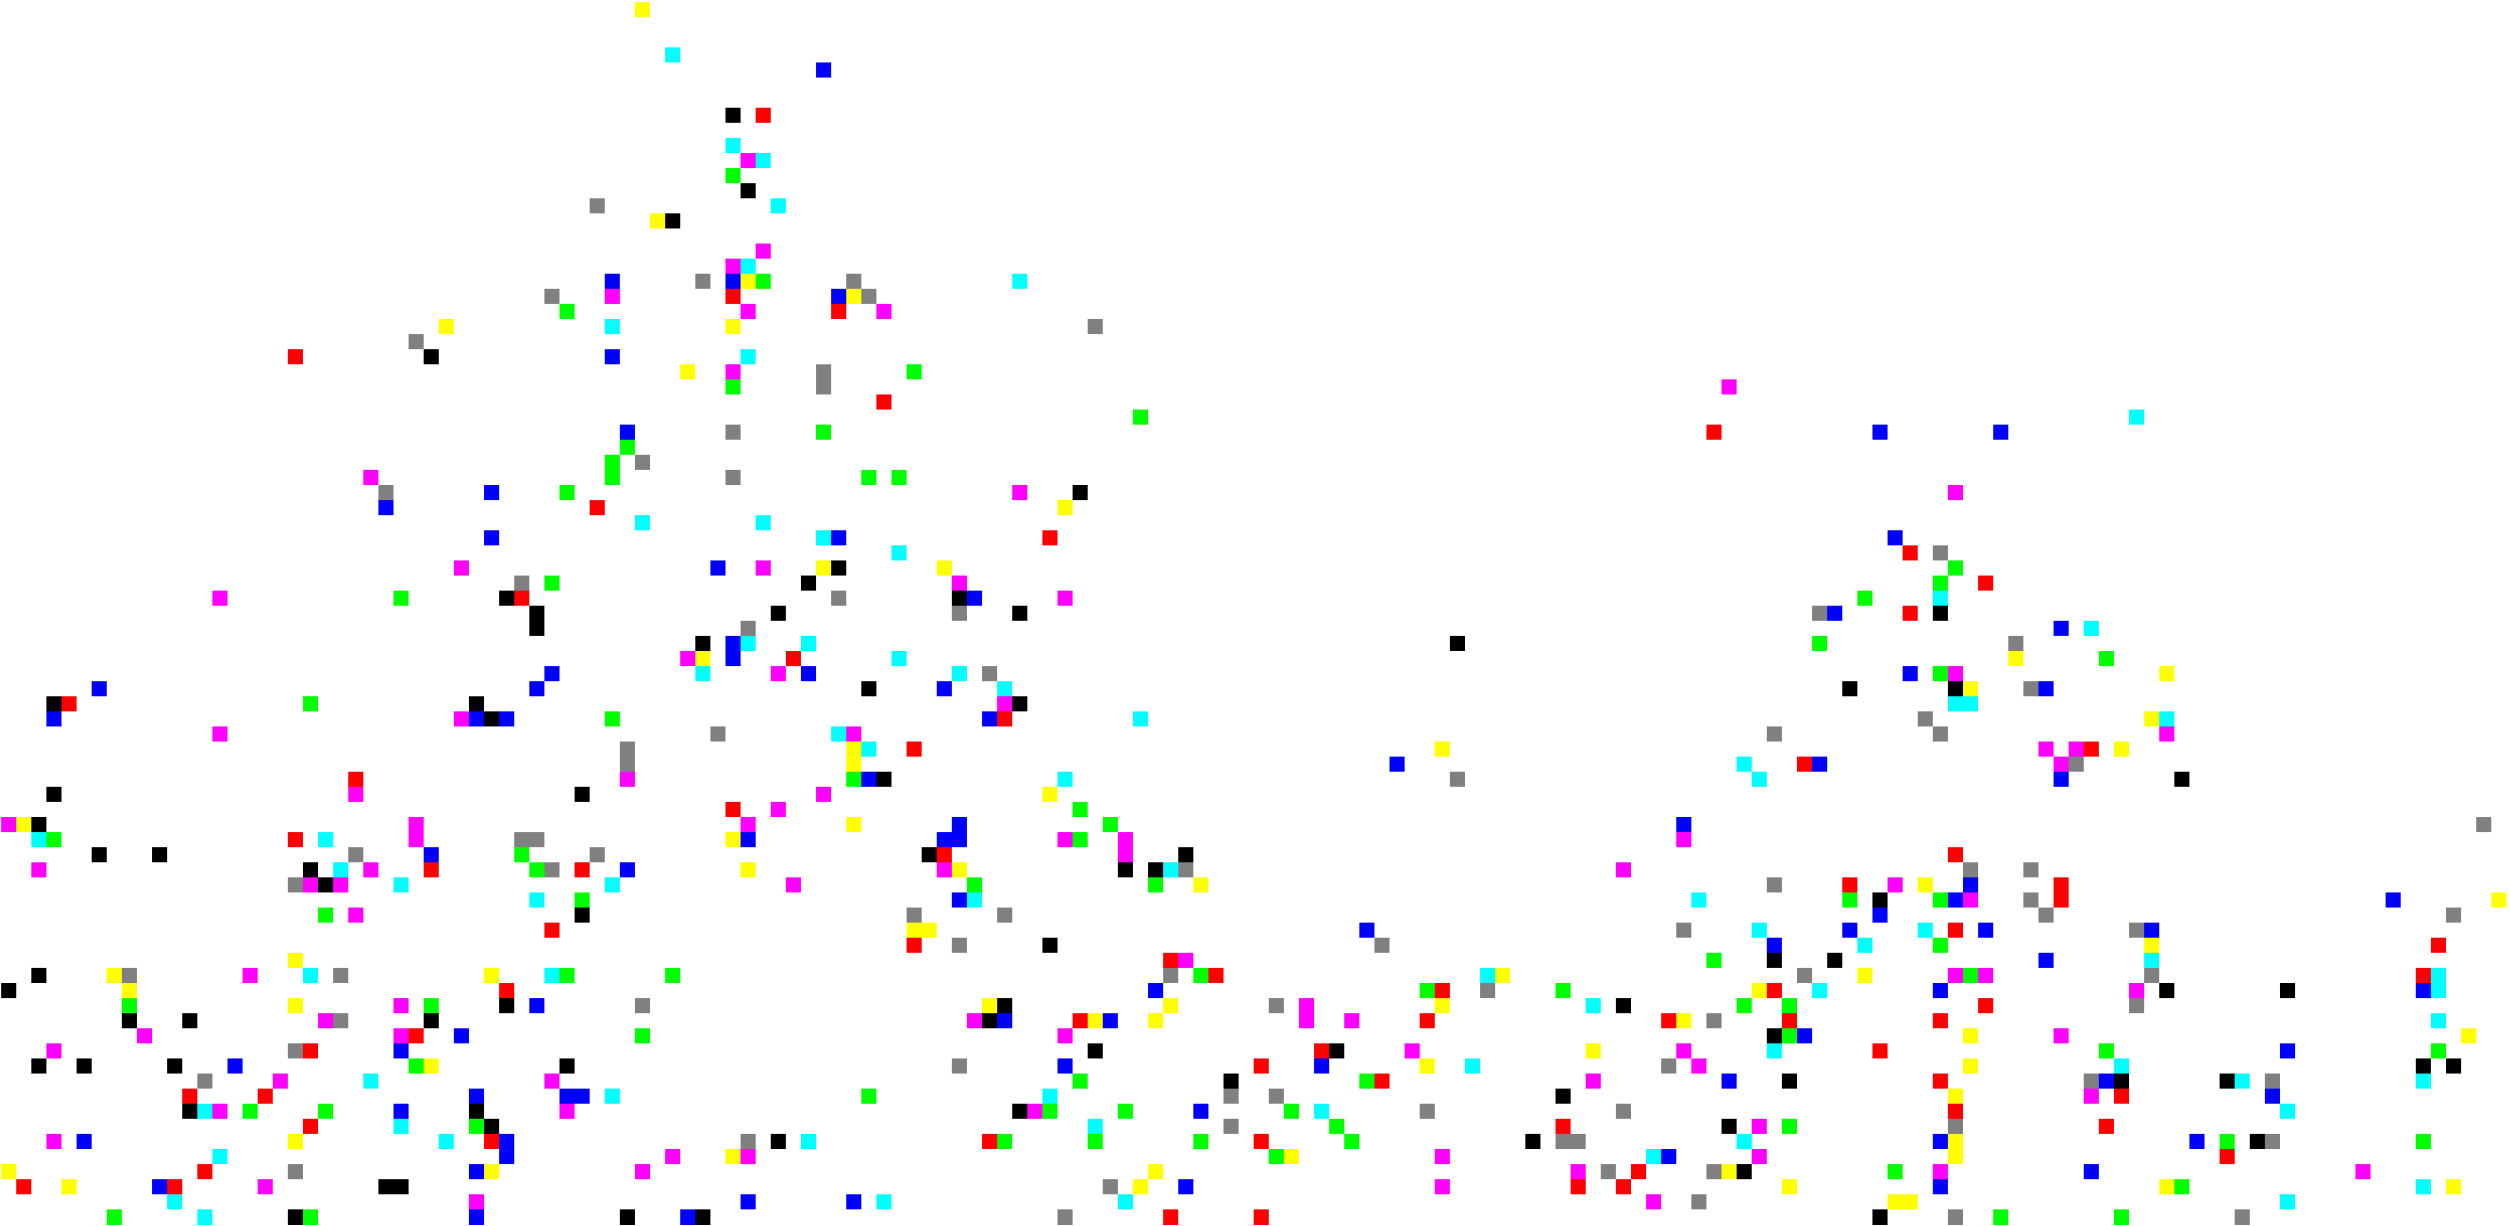 |
Figure 5. Detail of point cloud in Montjuic scene map corresponding to region in red box of Figure 1, before (left) and after (right) vector quantization. Colors represent different visual words, modulo 9.
Figure 1 displays an example of scene map construction. Here we depict 10 of the 30 images belonging to a visual cluster of Palau Nacional, Montjuic, Barcelona, in overlay after alignment. Of the 11623 features in total, 9924 are retained in the scene map after quantization, giving a compression rate of 15\%. In terms of inverted file entries (unique visual words), the figures are 11165, 8616, and 23\%, respectively. Detail of this scene map's point cloud is shown in Figure 5. Figure 6 displays another example of scene map construction, created by 12 images of Pantheon, Rome.

Figure 6. Scene map construction from 12 photos of Pantheon,Rome.
Scene Map Indexing
We extend the entire indexing, retrieval, and spatial matching scheme to operate on scene maps rather than images. This not only provides memory savings, but increases recall as well. At query time, it takes milliseconds to filter relevant scene maps, and a couple of seconds to re-rank according to geometry. The mining process is entirely automatic.
Once all scene maps have been computed, we build a separate index for them. Even if a scene map is typically larger than a single image, it has exactly the same representation, that is, a set of features. We therefore treat scene maps as images for indexing and retrieval and index all scene maps by visual word in an inverted file. At query time, we compute a similar vector for the query image, and retrieve relevant scene maps by histogram intersection and TDF-IF weighting. A shortlist of top-ranking scene maps is verified using RANSAC and whenever a scene map is found relevant, all images contained in it are considered relevant as well.
Location and Landmark Recognition
Once a list of verified images or scene maps is retrieved, we exploit their geo-tags to recognize the location where the query photo is taken. Of course, geo-tags of the images in the dataset have different levels of accuracy, and some may be completely wrong. We make here the assumption that even in the presence of outliers, there is a subset of photos that are correctly geo-tagged, and these geo-tags are not too far apart. Hence, we apply agglomerative clustering to the retrieved image locations and terminate when the minimum inter-cluster distance is above a certain threshold. The centroid of the most populated cluster is used to estimate the query photo location.
Locations and text (title, tags) of similar and nearby images are cross-validated with relevant information in Geonames entries and geo-referenced Wikipedia articles. Whenever a known landmark or point of interest appears in the photo, the relevant article is automatically linked to the photo.
A demo of the aforementioned visual matching, location and landmark recognition is available online (the VIRaL Tool). Through the online interface, a user can start a query either by uploading his own image or by choosing an image from the 1 Million Dataset. Figure 7 is a screenshot of a succesfull visual matching, location and landmark recognition using the VIRaL tool.
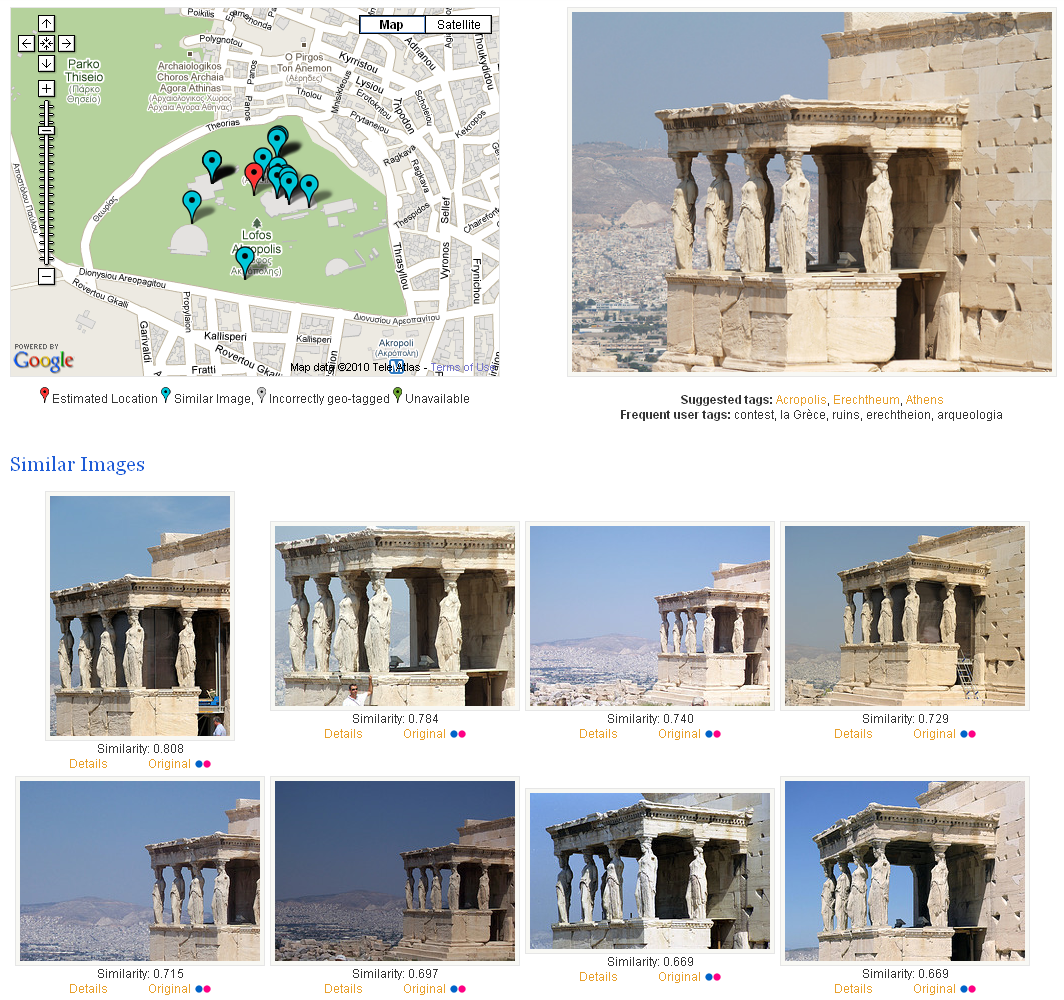
Figure 7. Results of successful visual matching, location and landmark recognition. Left: map depicting actual locations of the similar images (blue markers) and the estimated location of the query image (red marker). Right: query image along with the sets of frequent and suggested tags. Bottom: Retrieved visually similar images
We experiment on a challenging one million urban image dataset, namely European Cities 1M, which will soon be available in our datasets website. It consists of a total of 1.037.574 geo-tagged images from 22 European cities, which is a subset of the dataset used in the VIRaL application. A subset of 1081 images from Barcelona are annotated into 35 groups depicting the same scene, building or landmark. Well known landmarks of Barcelona are depicted in the 17 groups, while the rest 18 depict scenes or buildings around the city center.
Visual Similarity Evaluation
To evaluate the performance of the proposed method in terms of visual image retrieval, we compare mean average precision values on the aforementioned European Cities 1M dataset, measuring the ability of the proposed method to yield as results images belonging to the same group as each query. We compare our scene map retrieval efficiency against a baseline bag of words and two query expansion methods. The first (QE1) is the naive iterative approach, where we re-query using the retrieved images and then merge the results. For the second (QE2) we create a scene map using the initial response and re-query once more. All methods use the same spatial re-ranking approach.
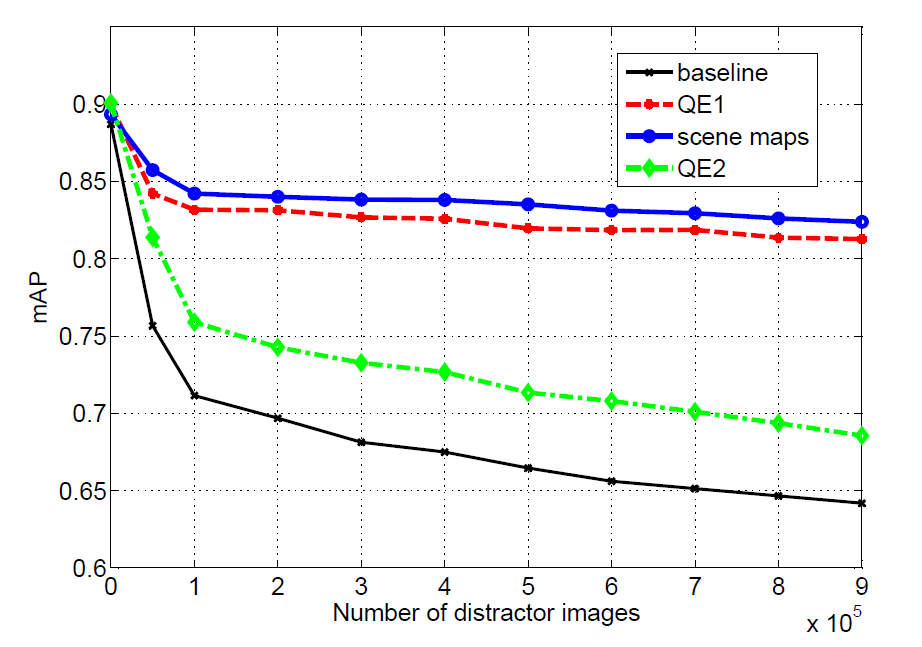
Figure 8. Mean Average Precision measurements for the four methods on the European Cities
1M dataset under a varying number of distractors.
The mAP measurements on the 157 ground truth queries for all four methods under varying size of distractor set are depicted in Figure 8. Observe that our method using scene maps (SM) outperforms all other methods in terms of mean average precision.
The annotated dataset used contains variable sized groups of images depicting the same scene. Small ones usually correspond to non-landmark scenes while large ones to well known landmarks. Achieving high recall scores is challenging when we deal with a large group of similar images. Re-ranking is only performed on the top ranked images and this can lead to missing quite a few images with the baseline method. Figure 9 shows mAP values for each query based on the size of the group of similar images corresponding to the query image. Observe that scene maps can yield total recall even for scenes containing more than 100 images.
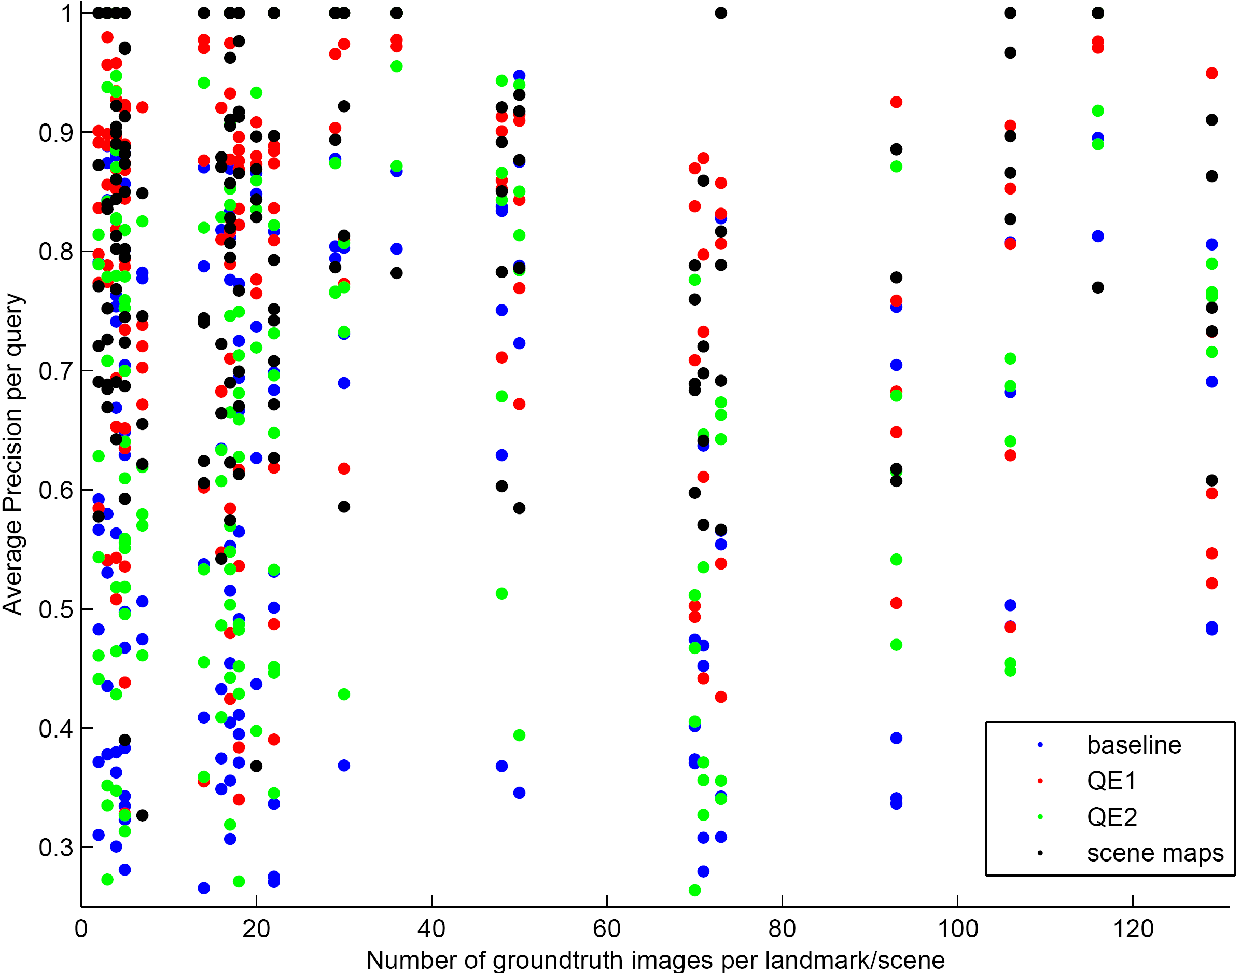
Figure 9. Average Precision for each query versus size of the corresponding ground truth group.
Location Recognition Evaluation
To evaluate our location recognition scheme, we compare the resulting estimation against the hand-picked geographic location information of each annotated group of images in our European Cities 1M. Localization accuracy in comparison to baseline and other methods is shown in Table 1. Localization performance is already high even for the baseline method. Still, our method using scene maps reaches the highest percentage.
| Method | Distance Threshold | ||
|
< 50m
|
< 100m
|
< 150m
|
|
|
Baseline BoW
|
82.5\%
|
91.6\%
|
94.2\%
|
|
QE1
|
86.3\%
|
93.5\%
|
96.2\%
|
|
QE2
|
86.7\%
|
93.3\%
|
96.5\%
|
|
Scene Maps
|
87.8\%
|
94.2\%
|
97.1\%
|
Table 1. Percentage of correctly localized queries within at most 150 meters from the ground truth location.
Landmark Recognition Evaluation
Since most photographers are taking pictures of well known landmarks, we assume that some of the annotated groups of images in our European Cities 1M dataset can be linked with Wikipedia articles. Given that the metadata of the images in our European Cities 1M dataset contain user tags, we analyze them, identify the landmark and suggest Wikipedia articles for each query.
| Landmark | Method | |||
|
Baseline
|
QE1
|
QE2
|
Scene Maps
|
|
| La Pedrera(a) | 0.326 | 0.588 | 0.377 | 0.901 |
| Park Guell(a) | 0.795 | 0.794 | 0.812 | 0.847 |
| Museu Nat. d' Art | 0.590 | 0.702 | 0.602 | 0.637 |
| Columbus Monument | 0.505 | 0.658 | 0.558 | 0.698 |
| Carrer B.I.-El Gotic | 0.449 | 0.917 | 0.555 | 0.739 |
| Port Vell | 0.332 | 0.746 | 0.380 | 0.480 |
| Sagrada Familia | 0.857 | 0.889 | 0.864 | 0.881 |
| Casa Batllo | 0.759 | 0.792 | 0.767 | 0.798 |
| Arc de Triomf | 0.840 | 0.889 | 0.847 | 0.882 |
| La Pedrera(b) | 0.651 | 0.921 | 0.939 | 0.903 |
| Hotel Arts | 0.560 | 0.773 | 0.573 | 0.633 |
| Hosp. de San Pau(a) | 0.317 | 0.580 | 0.423 | 0.838 |
| Hosp. de San Pau(b) | 0.421 | 0.776 | 0.502 | 0.709 |
| Park Guell(b) | 0.500 | 0.886 | 0.526 | 0.634 |
| Torre Agbar | 0.310 | 0.617 | 0.378 | 0.630 |
| Placa de Catalunya | 0.794 | 0.853 | 0.798 | 0.812 |
| Cathedral (side) | 0.487 | 0.864 | 0.546 | 0.972 |
Table 2. Percentage of correct Wikipedia article suggestions for each landmark and average percentage for the four methods.
The performance of the approach is shown in Table 2, where we see the percentage of correctly discovered links. Experiments are carried on 17 of the groups, that is the dataset subset which depict landmarks and has corresponding Wikipedia articles. We regard a query link suggestion as correct, if the ground truth article link is one of those suggested from the landmark recognition process. As the table shows, recognition for landmark queries is really efficient both with the use of scene maps and query expansion.
While mining from user generated content in community photo collections is becoming popular and new applications are emerging, several possibilities are still unexplored. Sub-linear indexing is not typically exploited in landmark recognition applications, while geo-tags are not typically exploited in large scale 3D reconstruction applications. We have combined both, along with a novel scene representation that is directly encoded in our retrieval engine. The result is a considerable increase in retrieval performance, even compared to query expansion methods, at the cost of a slight increase in query time. Memory requirements for the index are also considerably reduced compared to a baseline system. Contrary to landmark recognition applications, we can still retrieve any isolated image from the original database, allowing location recognition at any region where geo-tagged photos are available. Our mining process is even faster than other implementations that employ massive parallelism without exploiting geo-tags. We also recognize landmarks and points of interest by cross-validating location, photo title, frequent tags and geo-referenced Wikipedia article titles in an efficient online process.
Conferences
[ Abstract ] [ Bibtex ] [ PDF ]
Journals
[ Abstract ] [ Bibtex ] [ PDF ]
PhD Thesis
[ Abstract ] [ Bibtex ] [ PDF ]